8월 1주차 그래프 오마카세

A heterogeneous graph-based framework for scalable fraud detection
Introduction
지능범죄의 수법이 고도화됨에 따라, 악의적 의도를 가진 사람들의 횡포가 날이 갈수록 심해지고 있습니다. 이를 사전에 방지하기 위해 오늘도 다양한 곳에서 많은 노력을 기울이고 있습니다. 다양한 곳을 특정하여 이야기해보면 바로 FDS라고 할 수 있는데요. 합법 패턴과 불법 패턴을 분별하는것부터가 고역인 분야입니다. 까딱하다간, 합법인 사용자를 오인하여 제재할 경우에는 크게는 언론에 보도되어 기업 이미지가 실추될정도로 막중한 책임감을 가진 분야라고 할 수 있습니다.
그렇다면, 어떻게 이를 해결할까요? 완벽한 솔루션은 아직도 존재하지 않는다고 생각합니다. 완벽에 근접하기위해 룰 뿐만아니라, 머신러닝을 도입하는거죠. 패턴을 정량화하여 해석이 어렵다는 단점이 존재하나, 정량화된 값을 기반으로 ‘비슷한’패턴을 도출 및 분석하고 예측까지 할 수 있기에 많이 도입되고 있는 추세입니다. 하지만 이역시도 tree계열 모델을 사용하기에 FDS에서 중요한 요소라고 할 수 있는 ‘유저간의 직접적인 거래’ 즉, 관계를 반영하기엔 한계가 있기에 그래프를 보완재로 활용합니다.
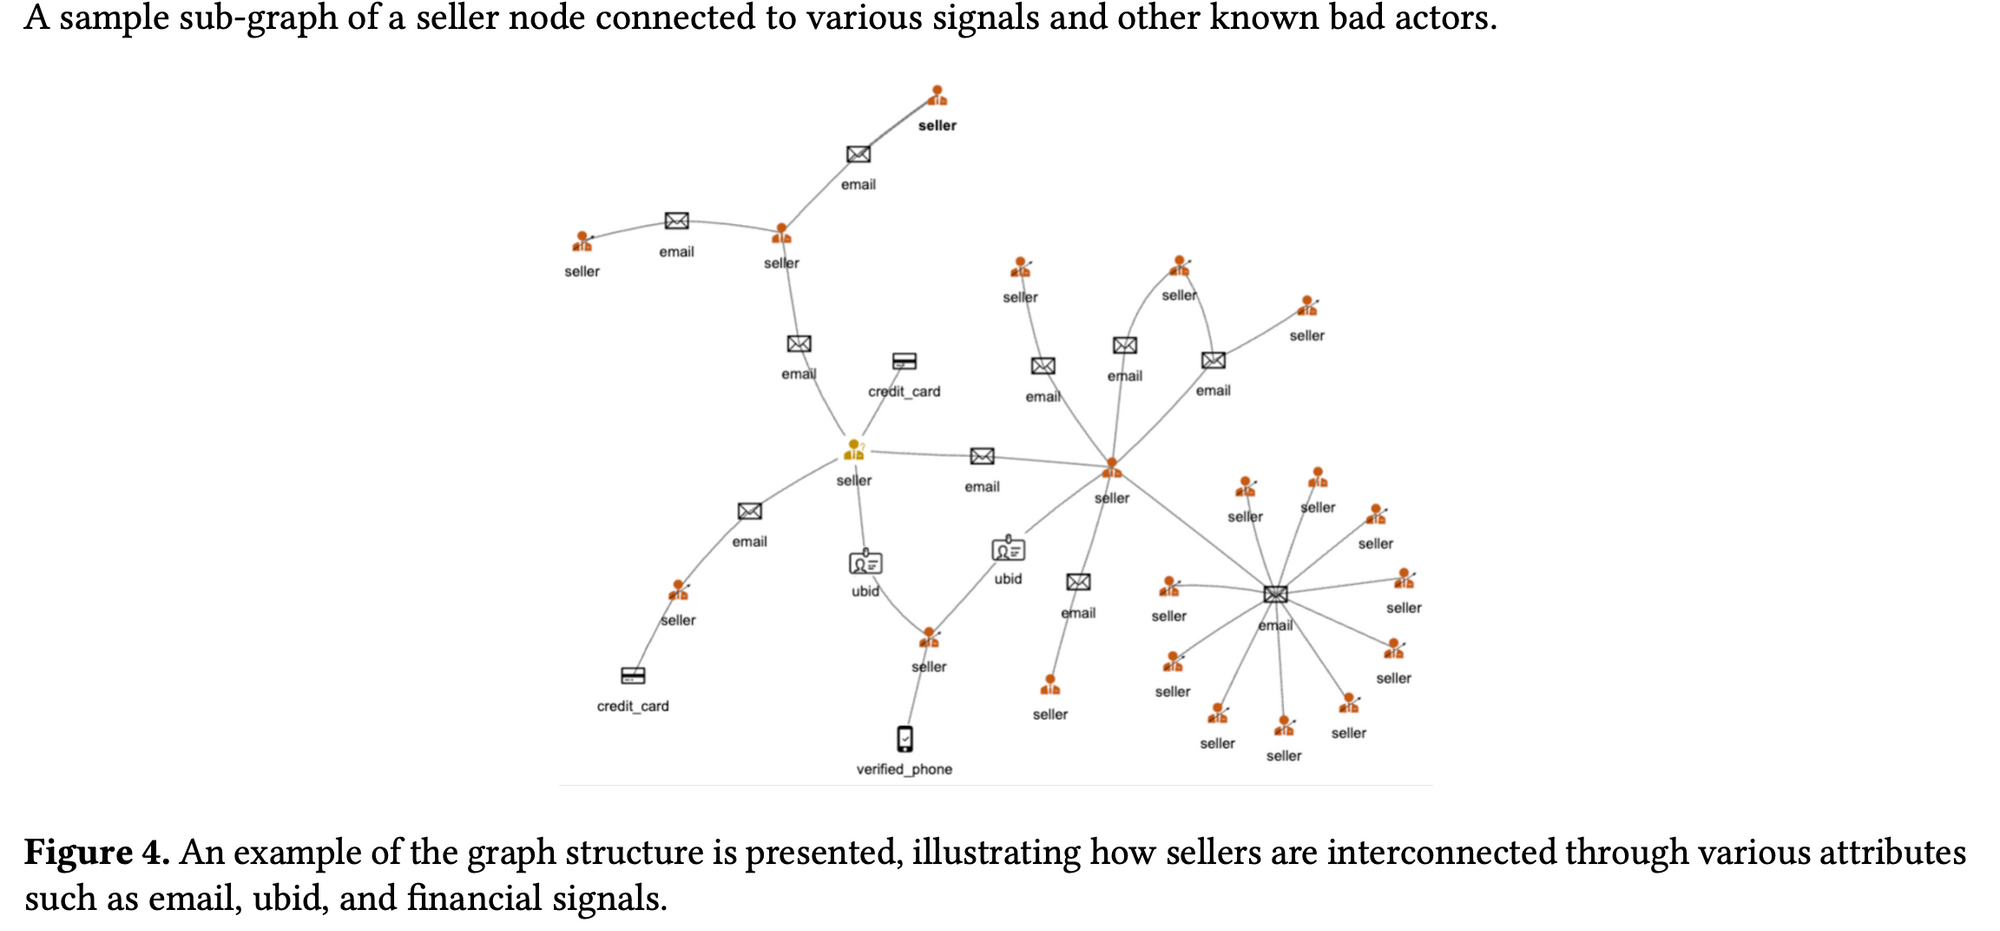
서론이 길었네요. 본 논문에서는 ecommerce 에서 고질적인 문제인 seller 들의 진화하는 사기 패턴을 탐지하고자 scalable GNN 을 제안합니다. 회원가입시 필수항목인 email, phone,credit-card 등의 정보들도 그래프 모델링에 반영하여 heterogeneous graph modeling 관점으로 이를 해결해보고자 시도합니다.
Preliminiary
[What is the ‘Focal-loss’?]
Focal Loss is a variant of the standard cross-entropy loss function that was introduced to address class imbalance issues in object detection tasks. It was proposed by Tsung-Yi Lin, Priya Goyal, Ross Girshick, Kaiming He, and Piotr Dollár in their 2017 paper titled "Focal Loss for Dense Object Detection."
The main problem with standard cross-entropy loss in the context of imbalanced datasets is that it treats all classes equally, which can lead to poor performance when certain classes are rare and underrepresented in the training data. Focal Loss aims to mitigate this issue by down-weighting the contribution of well-classified examples, allowing the model to focus more on hard and misclassified examples.
The Focal Loss function is defined as follows:
\[ FL(p_t) = -(1 - p_t)^\gamma \cdot \log(p_t) \]
Where:
- \( p_t \) is the predicted probability of the true class.
- \( \gamma \) is a tunable focusing parameter. \( \gamma = 0 \) corresponds to the standard cross-entropy loss, and increasing \( \gamma \) gives more emphasis to hard examples.
Pros of Focal Loss:
- Class Imbalance Handling: Focal Loss effectively deals with class imbalance problems by giving higher importance to hard examples, which can improve the model's ability to learn from rare classes.
- Better Convergence: Focal Loss often leads to faster convergence during training because it reduces the contribution of well-classified examples that dominate the loss in the early stages of training.
- Robustness to Hyperparameters: Focal Loss is relatively less sensitive to the choice of hyperparameters compared to other methods for handling class imbalance.
Cons of Focal Loss:
- Choosing the Focusing Parameter: While Focal Loss reduces the sensitivity to the value of \( \gamma \) compared to other hyperparameters, selecting the optimal value for \( \gamma \) can still be a challenging task. The appropriate \( \gamma \) value might vary depending on the dataset and the specific problem.
- Dependency on Well-Calibrated Probabilities: Focal Loss relies on well-calibrated probability estimates. If the model's predicted probabilities are poorly calibrated, the effectiveness of Focal Loss may be reduced.
- Application Limitation: Focal Loss is primarily designed for dense object detection tasks, and its benefits might not be as pronounced in other types of problems.
In summary, Focal Loss is a valuable tool for dealing with class imbalance and improving the performance of object detection models. It has shown promising results in various computer vision tasks and has been widely adopted in the field. However, its effectiveness can depend on the specific problem, dataset, and proper tuning of the focusing parameter.
Summary
GNN FDS 논문을 자주 읽으시는 분들에게는 익숙한 내용들이 많았을거라 생각되네요.RGCN 부터 mini-batch training 까지, GNN FDS 정석이 반영되어 있다 라고 생각하시면 되겠습니다.
- mini-batch 를 통해 전체 그래프에서 무작위로 노드와 엣지(subgraph)를 샘플링합니다.
- R-GCN 을 통해 각 샘플링 전략을 통해 도출된 서브그래프를 임베딩합니다.
- 임베딩한 결과값들을 기반으로 prediction 합니다. 이 때, loss 는 Focal-loss를 활용하여, 쉬운 task(label 이 많은 class)는 쉽게 풀게끔 Weight를 조정하고, 어려운 task(label 이 적은 class)는 어렵게 풀게끔 weight를 조정해주며 imbalanced 특성에 맞게 학습합니다.
- loss값 기반으로 파라미터를 업데이트 해줍니다. Adam optimizer을 사용하여 모델의 가중치를 업데이트합니다.
Takeaway
Cold-user non-feature
만일, 거래 정보가 극히 드문 cold-user가 있다면, 어떻게 feature를 선정할까요? 본 논문에서는 다음과 같이 feature 선정을 진행했다고 하네요.
cold-user , the attributes nodes in the graph were initialized with random embeddings, which were refined during the optimization step. During our analysis, we observed that there were some sellers with attribute data from seller relations data store but no node features available in seller feature store due to their inactivitiy, and vice versa. To ensure consistency in our study, we only included sellers with both attribute signals and node features
Focal-loss
오랜만에 보는 loss 계열입니다. imbalanced dataset 에 유용하다곤 하지만, 그래프 쪽에서 활용하는건 간만에 보네요. 아무래도 augementation , Sim 계열로 트렌드가 넘어오다보니 요즘엔 보기에 어려웠던것 같습니다. 하지만, scability 가 novelty 인 논문이기에, mini-batch 이후 Training loss 까지 적절한 논리적인 흐름을 위해 focal loss 를 사용했다고 생각합니다. real-world case에서도 개인적으로 loss tunning 이 그나마 합리적인 선택이라고 생각했기에 본 아키텍쳐 설계에 대해 감명깊었습니다.
chef blahblah
그래프를 통해 FDS를 적용하고 싶은 분들에게 좋은 교보재가 될 논문이라 생각합니다. 더군다나 레퍼런스가 Amazon science 이기에, 더더욱 신빙성이 있지 않을까 싶네요. 다만 아쉬운점은 논문 곳곳에서 feature 선정을 domain-expertise 을 통해 했다 적혀있지만 구체적으로 어떤 feature를 활용했는지에 대한 기록은 없습니다.
아쉽긴하지만, 그래도 저희가 유념해야할 부분은 머신러닝 학습전, 어떤 feature 그리고 어떻게 graph 를 설계할것인가가 굉장히 중요하다라는 점입니다. 몇백개부터 몇천개까지 다양한 feature , 그래프 모델링 후보군이 있겠지만, 후보군에 대한 고민의 질량에 따라 설계한 모델의 성능이 좋아질 수 있으니 최종적으로는 악의적인 패턴을 탐지하여 선의의 피해자가 발생치않게 사회에 기여하는 모습을 떠올리며 사명감을 가져보면 어떨까 싶네요.
HYTREL: Hypergraph-enhanced Tabular Data Representation Learning
[https://arxiv.org/pdf/2307.08623.pdf]
Introduction
제목만 보아서는 Knowledge graph , data integration 과는 전혀 연관이 없는 논문같아보입니다. 하지만, 속을 들여다보면 굉장히 연관이 깊은 논문입니다. 바로 tabular dataset 의 invarance 특성을 활용하여 two knowledge extraction tasks, a table type detection task, and a table similarity prediction task 4가지 task 를 수행 및 비교하는 아이디어인데요. 이게 그럼 무슨 관련이 있느냐? 라는 의문이 드실텐데 바로, knowledge base → knowledge graph → documentation relationship discovery 3단 연계의 목적인 data integration task와 비슷한 맥락을 띄기 때문입니다.
조금만 더 깊게 이야기해보자면, 결국 데이터 통합은 사내 여러 데이터들간 관계를 토대로 조금 더 유의미한 인사이트를 도출하기 위함인데, 이 ‘데이터들간’ 은 결국 tabular data, 테이블 데이터들의 집합체 라는거죠. 물론 비정형 데이터인 문서들이 위주일경우도 존재하겠으나, 이것도 마찬가지로 비정형에서 정보를 추출하여 정량적으로 변환후 관계를 이어주기때문에 결국 비슷한 맥락이라 할 수 있습니다.
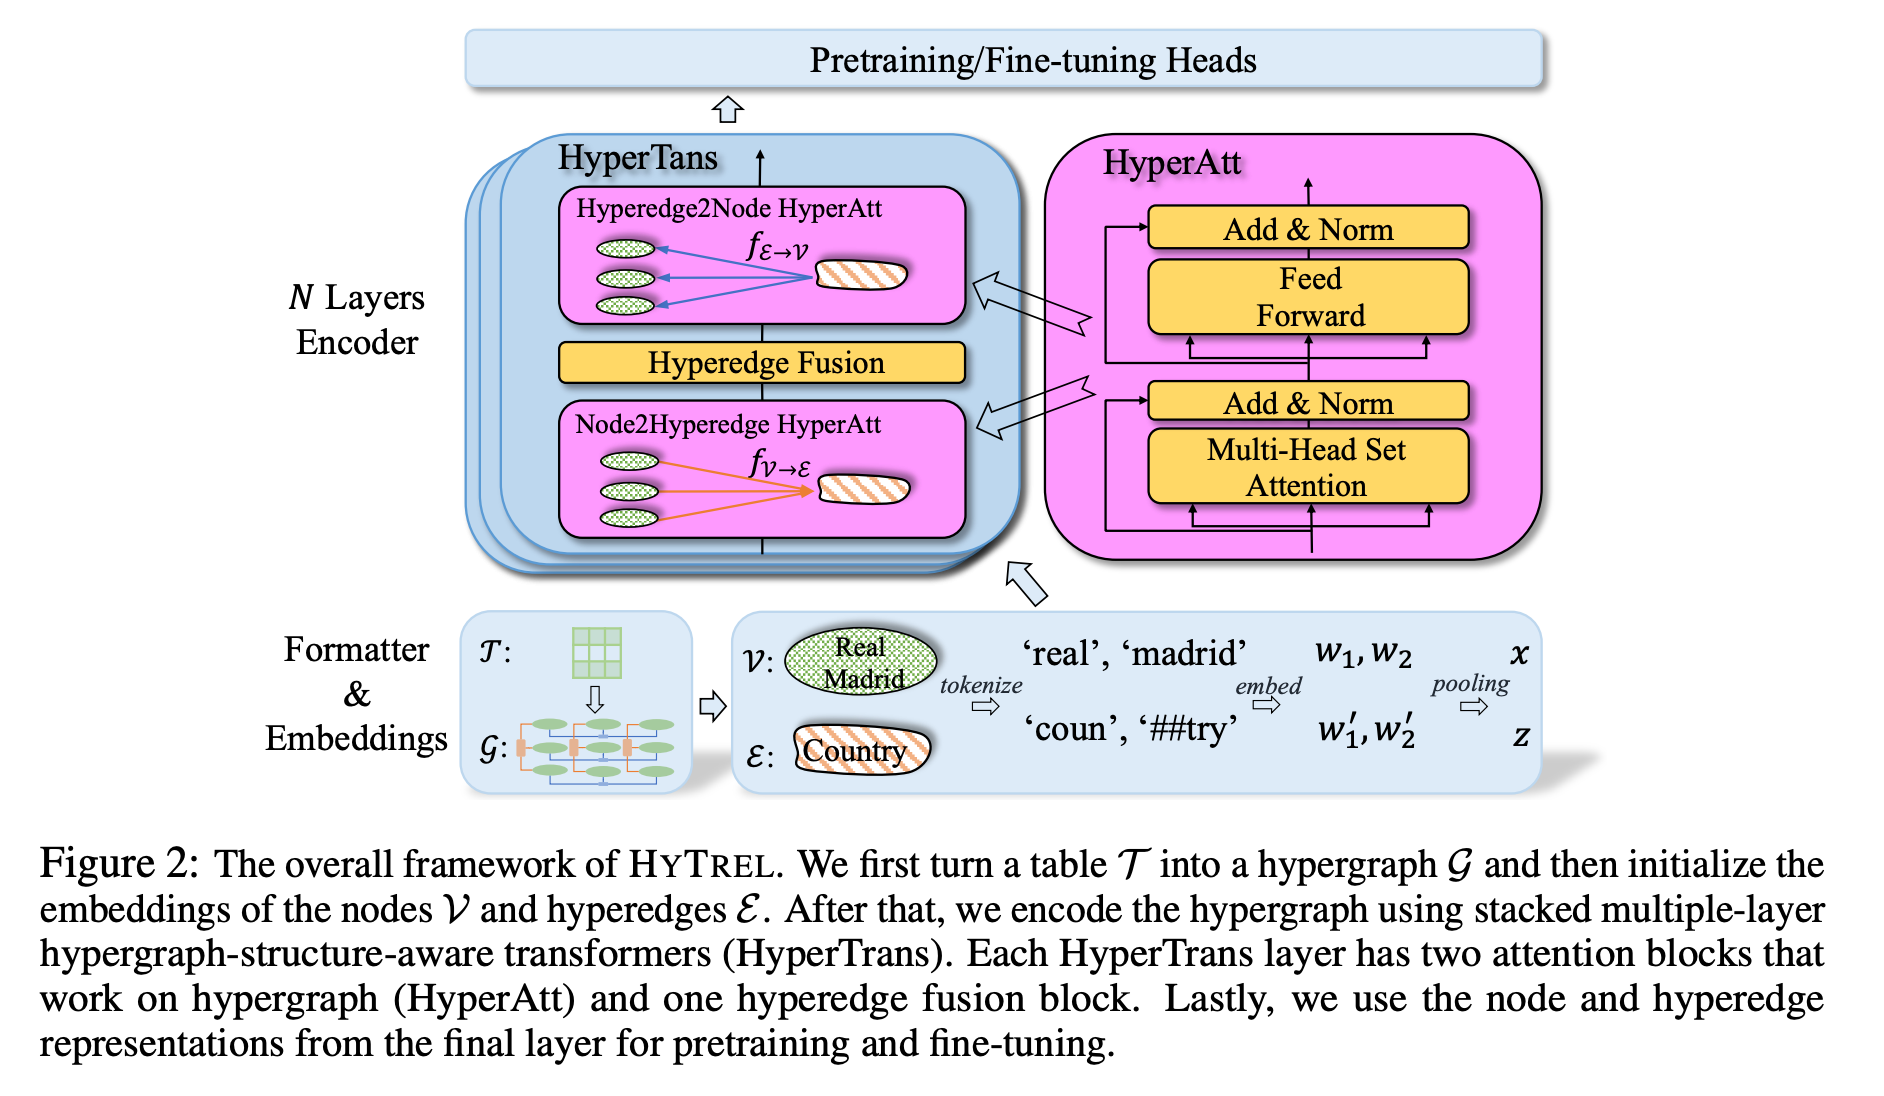
본 논문은 이 데이터 통합을 위해 hypergraph 관점을 적용했습니다. row, column, cell, table 를 4가지 종류의 hyperedge라 간주하여, graph 형태로 변환 후, 임베딩 그리고 context 를 추출하는거죠.
Preliminiary
[tasks associated with this paper]
- Column Type Annotation (CTA): Column Type Annotation is the task of automatically identifying and assigning data types to the columns in a structured dataset, such as a table in a relational database or a spreadsheet. The goal is to infer whether each column contains numerical values, categorical data, dates, text, or other specific data types. CTA is essential for data preprocessing and analysis, as it helps ensure data integrity and enables appropriate processing and querying of the dataset.
- Column Property Annotation (CPA): Column Property Annotation involves automatically identifying and annotating specific properties or characteristics of the columns in a structured dataset. These properties could include information like the presence of missing values, uniqueness of values, cardinality (the number of distinct values), or statistical properties like mean and standard deviation for numerical columns. CPA aims to provide additional insights about the dataset, enabling better data understanding and preparation.
- Table Type Detection (TTD): Table Type Detection is the task of classifying the type or category of a given table in a structured dataset. This categorization could be based on the content or purpose of the table. For example, a table might be classified as a customer database, a product inventory, a financial statement, or any other predefined type. TTD helps in organizing and managing large datasets by automatically labeling tables, which can be beneficial for data cataloging and search.
- Table Similarity Prediction (TSP): Table Similarity Prediction involves quantifying the similarity between two or more tables in a structured dataset. The goal is to determine how closely related the content and structure of different tables are. Similarity can be measured using various metrics, such as the Jaccard index for comparing sets of column names or content-based metrics that consider the values within the tables. TSP aids in data integration, data cleaning, and data exploration tasks by identifying tables that share similar information.
Summary
Hypergraph 를 통해 permutation invarances 를 잘 보존하고 잘 활용하는게 핵심인 아이디어 입니다.
크게 4 챕터로 이루어져 있습니다.
- Formatter & Embedding Layer : 하이퍼 엣지를 어떻게 설계할지에 대한 설명이 적혀있는 란입니다. 테이블내의 구조중 cell를 노드라 가정하고, column , row 그리고 table 를 하이퍼 엣지로 가정합니다.
- Hypergraph Encoder : Formatter & Embedding Layer' 과정으로부터 도출된 하이퍼 그래프를 임베딩 하기 위해 initialized 한 후, HyperTrans를 사용하여 인코딩됩니다. 하이퍼트랜스 인코더는 테이블 컨텐츠, 구조 및 테이블 요소(셀, 헤더, 캡션 등 포함) 간의 관계를 인코딩할 수 있습니다. 이 때 invariance feature를 적용하기 위해 트랜스포머 구조를 차용하긴 했으나 , attention 을 제외하고 마지막 embed 값을 종합할때, Deepset model 알고리즘을 차용하여 pooling function을 활용합니다.
- Invariances of the HYTREL Model : 본 아이디어가 어떻게 permutation invariances of table 성질을 활용하는지에 대해 언급한 챕터입니다. 테이블 내 정보량을 최대화 하기 위해 어떻게 하이퍼그래프를 적용하고, 테이블 형태를 변형하는지에 대해 적혀있기에 핵심 중 핵심을 다루는 부분이라 할 수 있습니다.
- Pretraining Heads : 이 논문은 Pretraining 을 통해 table structure representation learning 성능을 향상시키는 방안도 적용합니다. 2가지 pretrained head 를 활용합니다. 1.ELECTRA head, 2. contrastive head 입니다. ELECTRA head는 ELECTRA pretrained-setup에서 모델을 사전 교육하는 데 사용되며, 여기서 테이블의 셀과 헤더의 일부가 먼저 손상된 후 모델은 주어진 셀 또는 헤더가 손상되었는지 여부를 예측합니다. contrastive head는 대조 사전 교육 설정에서 모델을 사전 교육하는 데 사용되며, 테이블 변환 하이퍼그래프는 무작위로 손상되고 해당 하이퍼지의 테이블 및 열 표현은 대조됩니다.
Takeaway
Room for improvement
hypergraph 설계를 할 때, table dataset dominant 에 대해 집중할 수 있는 모듈이 추가된다면 더욱 좋은 아이디어가 될 수 있을거라 생각되네요. 지금은 단순하게 row column table 를 기반으로 pooling 했으나, 데이터를 분석하다보면 categorical 데이터 중 굉장히 다양한 데이터가 있는반면 다양하지 않은 데이터들도 있기 마련입니다.
이 때, 이를 단순하게 hypergraph로 표현한다면 중복을 제거한 unique 로 간주하여 진행하기에, 데이터 본연의 정보를 오히려 소실하게 되는 문제가 발생하게 됩니다. 이를 방지하기 위한 무언가를 추가해본다면 어떨까하는 생각이 들었던 논문이였습니다.
chef blahblah
서두에 언급한바와 같이 non-label table 이 많은 상황 혹은 잦은 data 스키마 설계 변동으로 데이터가 관리되고 있지 않을때, 어떻게 이를 처리하면 좋을까에 대한 힌트를 줄 수 있는 논문이라 생각합니다.
다만, 이 방식을 모두 적용하기 위해서는 데이터 스키마 설계 부터 자연어 처리에 대한 지식 그리고 hypergraph 에 대한 지식까지 굉장히 높은 난이도를 요하는 분야이기에, 이 통합관리 업무가 정말 유의미한 프로젝트가 될 수 있을것인가에 대해 기획이 매우 중요할거라 생각되네요.