6월 3주차 그래프 오마카세


이번주차 graph travel preview 입니다. node classification 에 중점을 두었기에 평소에 이 부분에 대해 궁금하셨던분들에게 추천합니다.
Erica 님의 큐레이션이 더해져 있기에, 재밌게 공부하실 수 있을겁니다 :)
Random Walk
Node Embedding
Deep Walk (Word2Vec - Skip-gram)
Node Classification
Is Rewiring Actually Helpful in Graph Neural Networks?
[https://arxiv.org/pdf/2305.19717.pdf]
Introduction
왜 over-squashing 에서 rewiring 이 효율적일까? 라는 호기심을 가지고 계셨던 분들에게 도움이 될만한 논문입니다. 논문 저자도 앞서 이야기한 물음과 같이 과연 ‘rewiring’ 이 과연 GNN에서 효율적인가 를 알아보기 위해 다양한 실험을 시도해서 재밌는 인사이트를 도출했습니다.
over-squashing의 원인인 bottleneck 를 탐지하여, bottleneck 에 집중되는 정보를 적절하게 분배하기 위해 적합한 노드를 찾아 연결해주는 rewiring 일련의 행위(pre-processing)에 대해 문제를 제기합니다. 과연 그래프에 담긴 고유 구조 정보를 인위적으로 변형하는게 옳을까? 옳지않다면 어떤 방식으로 이를 비교하면 좋을까를 고민하다가 생각한 대조군이 바로 ‘training-free’ 즉 non forward,backward 입니다.
Preliminary
[rewiring core concept]
diffusion process, local bottleneck, global bottleneck, efficient resistance
** 7월 중순에 rewiring 관련해서 온라인 세미나가 예정되어 있으니, 관심있으신분들 신청해주세요!
Summary
** training 을 본 논문에서는 forward, backward 를 통해 발생하는 gradient update 등 graident 관련 연산을 의미합니다.
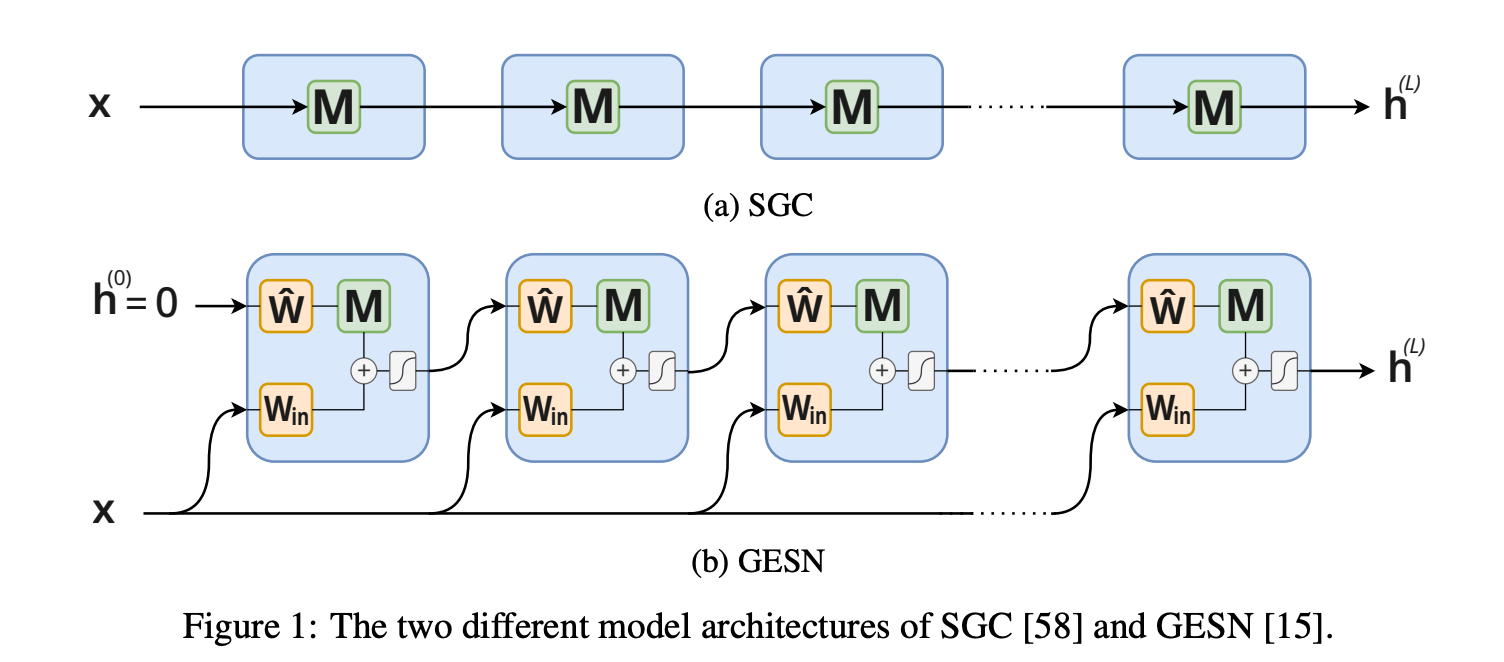
non-training 하면 떠오르는 모델 , LightGCN 의 motivation 바로 SGC 와 일전에 언급한 개념인 reservoir computing 개념을 적용한 모델 GESN 두 training-free 모델을 활용합니다.
SGC 는 non-linearity activation 을 제거해서 weight update 가 아닌 input feature 에만 의존하여 update 가되는 형식이기에 training-free 모델입니다.
$$ h (L) = M^Lx $$
GESN은 input-to-reservoir, bias, and recurrent weights for a reservoir 3가지 weight 를 초기에 random initialize 하여 적용해주기에 이후 gradient 연산이 발생하지 않기에 training-free 모델입니다.
$$ h^{(k)}{v} = tanh(W{in}x_{v}+\sum_{u \in V} M_{uv}\hat{W}_{h}^{(k−1)}+b) $$
위 training-free 모델들과 training 모델(end-to-end)을 비교합니다. 그리고 training-free 모델에 rewiring methods를 접목하면 퍼포먼스가 어떻게 변화할지에 대해서도 이야기합니다.
Insight
Rewiring method 에 대한 개괄이 잘 녹여있는 논문입니다. GNN 토폴로지를 고려하고자 GNN Layer 디자인하실때, 왜 레이어를 늘리고 줄여야하는지에 대해 타인에게 설명할 때 유용할거라 생각합니다. 특히 Result 부분에서 논문 저자가 edge curvature distribution , edge curvature viration 그리고 Effect of spectral gap 에 따라 달라지는 결과를 bottle-neck과 연계지어 설명하는 부분은 너무나도 좋은 인사이트이기에 , 유념하시면서 논문을 보기를 추천합니다.
Filtering higher-order datasets
[https://arxiv.org/pdf/2305.06910.pdf]
Introduction
hypergraph의 핵심인 hyper-component 디자인에 대해 고민이셨던 분들에게 도움이 될 논문입니다. attribute 를 categorical 형태로 변환해서 도출한 joint subset 을 기반으로 hyper-component 를 설계했던 방식에 filtering 관점을 추가로 도입하여 어떤 hyper-component design 이 좋을지에 대해 이야기합니다. 다시말해서, hyper-component standard 를 정립하는 과정을 본 논문에서 다룹니다.
Preliminary
[Utilization filtering technique in this idea.]
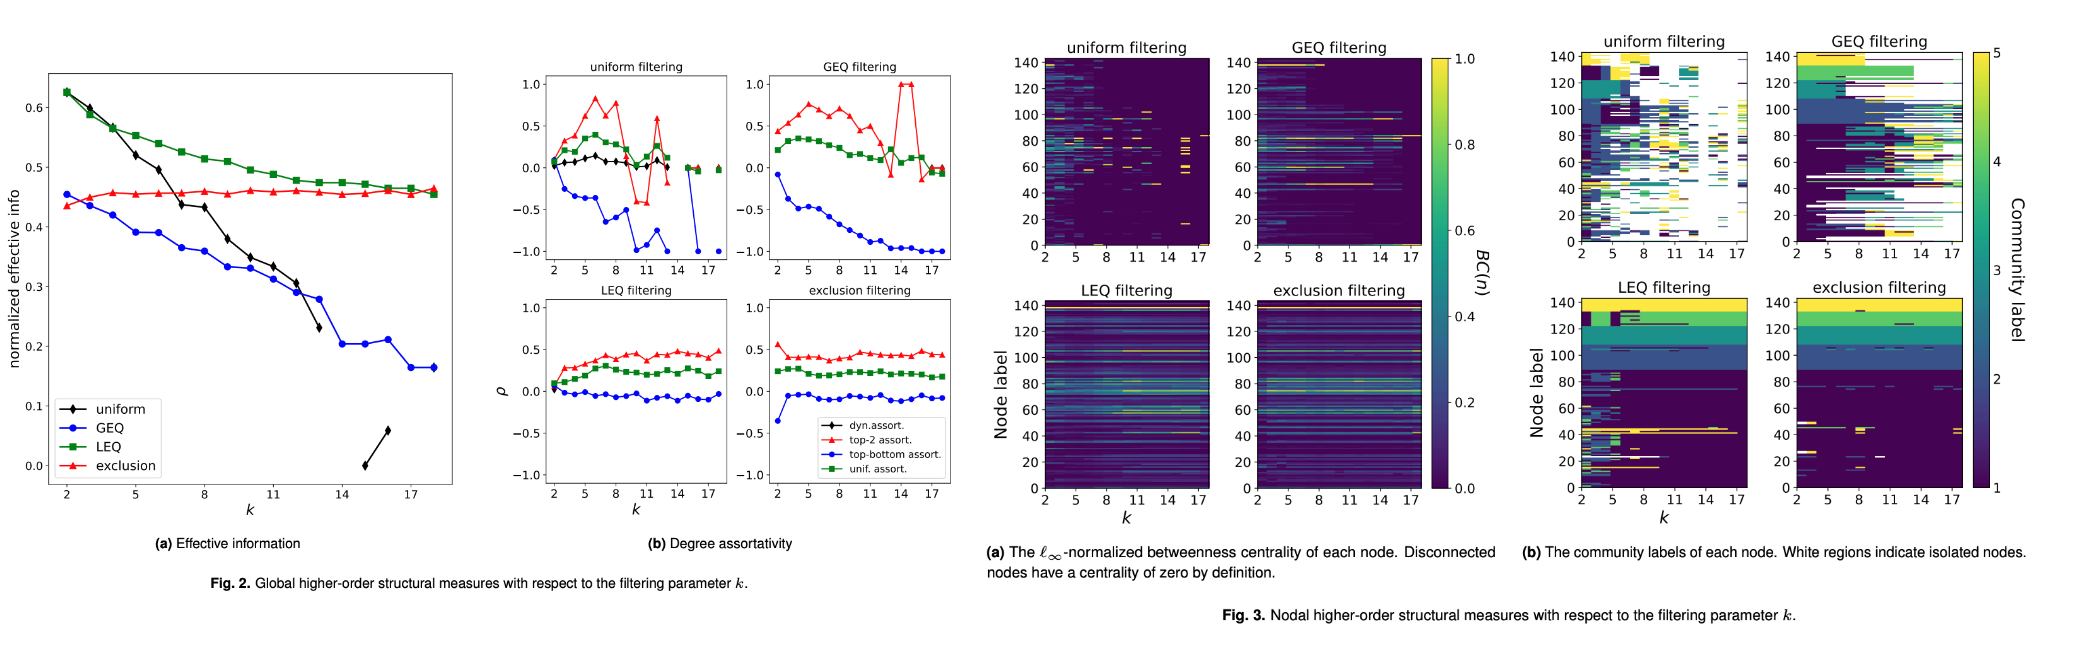
Uniform filtering, H(=,k).
This type of filtering may be used to isolate the structure associated with a particular hyperedge size.
GEQ filtering, H(≥,k).
This filtering can be used to see the effect of excluding pairwise interactions or hyperedges with smaller cardinality. One can call this the “higher-order” filtering for its ability to remove low-order interactions.
LEQ filtering, H(≤,k).
This filtering can be used to exclude higher-order interactions. As before, one can also call this the “lower-order filtering.” This has been used to construct some of the datasets in Ref. (the author constructs hypergraphs with hyperedges of size ≤ 25) and other papers that observe the effect of higher-order interactions by only including 2- and 3- hyperedges.
Exclusion filtering, H(6≠m).
This filtering can be used to exclude interactions of a particular size. This can be helpful when considering datasets where a particular interaction size significantly alters the structure of a hypergraph — whether through a large number of edges or a significantly anomalous structure — and one desires to exclude that interaction size.
Summary
Structure measure인 global , nodal 그리고 Cluster label matching 3가지 기준치를 기반으로 Filtering 결과에 대한 품질을 검증합니다.
Insight
heuristics 하게 디자인했던 기존방식과 다르게 철저히 usefulness 를 토대로 이를 설명하기에 network science practitioner에게도 많은 도움이 되겠습니다. 무슨 기준치가 과연 네트워크 우수성을 검증할 수 있는지? 에 대해 되게 막연하고 모호한 관점을 가지고 있던 분들에게 많은 도움이 될 거라 생각되네요. 또한, 연구적인 측면뿐만아니라 실무적인 측면에서도 discussion 섹션에서 좋은 인사이트를 전달하고 있기에 graph modeling 에 대한 고민이 있으셨던 분들에게도 추천합니다.
FRAUDAR: Bounding Graph Fraud in the Face of Camouflage
[https://bhooi.github.io/papers/fraudar_kdd16.pdf]
Introduction
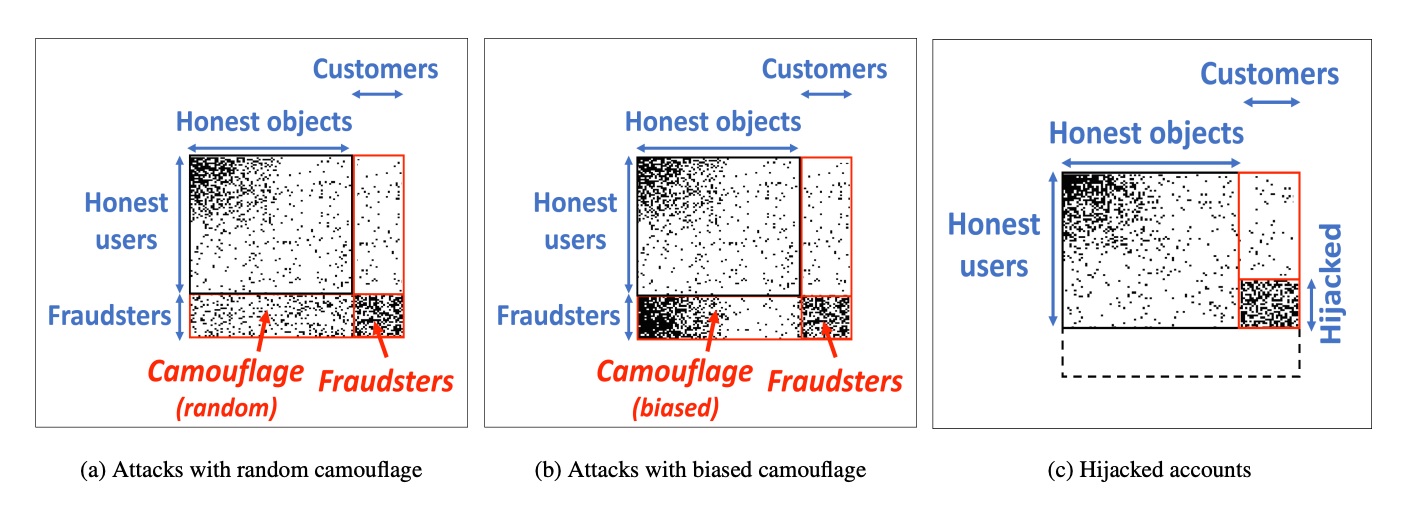
Fraud 의도를 가진 사용자들을 잡아내기에는 한계점이 너무나도 많습니다. 한계점 중 대표적인 예시 하나를 이야기해보자면, normal user 들의 행동 패턴을 교묘하게 섞어서 Fraud 라는 기준치를 측정하기 어렵게 만드는 것을 꼽을 수 있습니다. Normal 과 Fraud 를 아슬아슬하게 줄타기하는것 , Fraud rule 을 만드는 사람들에게는 굉장히 중요한 영역이라고 할 수 있습니다.
반면 이를 캐치하는 영역인 Fraud detection는 시시각각 변하는 룰들을 선제적으로 대처하기 어려우니, 후행적으로라도 빠르게 탐지한 뒤 사후대처를 하는게 중요하다고 할 수 있습니다. 그럼 ‘빠르게 탐지’를 하기 위해 그 기준을 세워야할텐데요. 가설을 설정하고 검증하는데에 있어 많은 어려움이 존재합니다.
본 논문에서는 이 가설을 설정하고 검증하는 일련의 Fraud detection 개발 과정을 잘 담아 놓았습니다. FDS with Graph 를 고려하고 계시는 분이시라면 많은 도움이 될거라 생각합니다. 논문의 연식은 오래되었으나, ‘고전이 명작이다’라는 말을 빌려써도 될 정도의 논문 아이디어가 너무나도 좋습니다.
Preliminary
[Why Graph-based system is useful in FDS?]
Graph-based systems are highly beneficial in the fraud detection industry due to their ability to uncover complex patterns and relationships in data. Here are some reasons why graph-based systems are helpful in fraud detection:
- Relationship Analysis: Fraudulent activities often involve intricate networks and relationships between entities such as individuals, accounts, transactions, and organizations. Graph-based systems excel at modeling and analyzing these relationships, allowing for a comprehensive view of the connections between different entities. By representing data as a graph, it becomes easier to identify suspicious patterns and detect fraudulent behavior.
- Link Analysis: Fraudsters often attempt to disguise their activities by spreading them across multiple entities or accounts. Graph-based systems enable link analysis, which involves tracing the flow of funds, goods, or information through a network. By following the links between entities, suspicious patterns and hidden connections can be revealed. This approach is particularly useful for detecting money laundering, organized fraud rings, and complex fraud schemes.
- Pattern Detection: Graph-based systems can identify recurring patterns of fraudulent behavior by analyzing historical data. By examining the graph's topology and identifying common motifs, anomalies, or clusters, patterns indicative of fraud can be uncovered. These patterns might be challenging to identify using traditional rule-based systems or statistical methods alone.
- Real-time Monitoring: Graph-based systems can handle large volumes of streaming data in real-time. As new data arrives, the graph can be updated and analyzed continuously to detect emerging fraud patterns or new connections. This capability allows for proactive fraud prevention and quicker response times to potential threats.
- Collaboration and Intelligence Sharing: Fraud detection often requires collaboration among different organizations, such as financial institutions, law enforcement agencies, and regulatory bodies. Graph-based systems provide a common framework for data integration and collaboration. Multiple entities can contribute their data to a shared graph, enabling cross-organizational analysis and intelligence sharing. This collective approach improves the overall effectiveness of fraud detection efforts.
- Visualization and Interpretability: Graph-based systems offer intuitive visual representations of data, allowing analysts to explore and understand complex fraud networks more easily. Visualizing the graph can reveal hidden patterns, outliers, and potential fraud hotspots. Moreover, graph-based systems provide interpretability by showing the connections and reasoning behind fraud detection alerts, which aids investigators in understanding the underlying evidence.
Overall, graph-based systems offer a powerful and flexible approach to fraud detection by leveraging network analysis, relationship modeling, and pattern detection. These capabilities enable organizations to detect and mitigate fraud more effectively, reduce false positives, and stay one step ahead of increasingly sophisticated fraudulent activities.
Summary
Metric(선별기준)을 통해 어떤식으로 Fraud를 선별할지, 선별된 정보를 어떤식으로 보관할지(Priority Tree) 그리고 이 자동화 과정을 어떻게 최적화할지(Theoretical Bounds) 를 개발하여 하나의 알고리즘 형식으로 잘 나타냈습니다. 또한, 수학적인 근거를 통해 본 알고리즘이 FDS 에서 왜 유효한지에 대해 설명하기에 토대가 굉장히 탄탄하다고 할 수 있습니다. “~하니까 되더라” 하는 막연한 FDS 알고리즘들의 설명들에 지치신 분들이라면 쌍수를 들고 환영하실 논문이지 않을까 싶네요.
FDS 하면 금융 분야 부터 떠올리실텐데요. 본 논문은 ‘금융’ 을 제외한 다른 데이터 도메인에 적용하여 실험했기에, 금융 FDS 를 생각하셨던 분이라면 아쉬움이 있을거라 생각되네요.
Insight
알고리즘 우수성을 입증하기위해 실제 Twitter data (real-data)를 labeling 하여 rule-pattern matching 한 결과와 알고리즘 결과를 비교하는 섹션이 있습니다. 당연하게도 성능이 좋다고 합니다. 성능 우수성도 물론 중요하지만, Graph-based FDS 산업계 적용 당위성에 대해 흔쾌히 답변할 수 있게 해주는 즉, 적용 가능성을 보여주는 사례이기에 이 점에서도 시사하는바가 큰 논문이라고 생각합니다.
[kcc 2023 출장 수련 왔습니다.]
그래프 오마카세를 연재하며 궁금했던 부분을 연구로 풀어낸 결과가 accept 되어 운좋게 발표할 기회를 얻게 되었습니다. 오마카세 독자분들중 KCC2023에 참여하신 분이 계시다면 연락주시면 이와 관련해서 이야기 나눠보아도 좋을거 같네요! 부담없이 연락주세요 :)